
Key Indicators To Watch – Real Economy
Note: Here are key indicators, indexes, surveys of what is happening in the real economy of goods and services that consumers, retirees and workers experience day to day. We contrast our real economy indicators with those promoted by the Federal Reserve, Wall Street and government agencies where they use academic indicators to maintain the monetary economy where most benefits go to the wealthy.
Inflation
Real inflation is an average of 10.6% for the Top Ten Cities – Chapwood Index to 50 Cities (prices of 500 items that consumers buy not price adjusted, updated twice a year). By Ed Butowsky, Managing Partner, Chapwood Investments
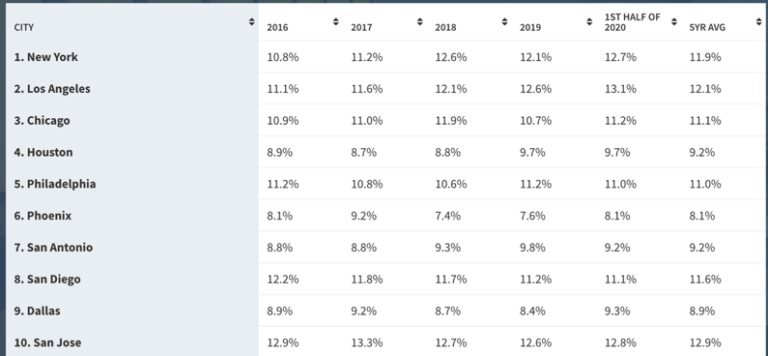
Source: Chapwood Index – 1/12/21
The Federal Reserve uses the Consumer Price Index computed by the Bureau of Labor Statistics using a ‘consumer behavior’ model of raw data that BLS will not publicly release and allow academics to review. It consistently is much lower than consumers experience at 2% or under since 2008.
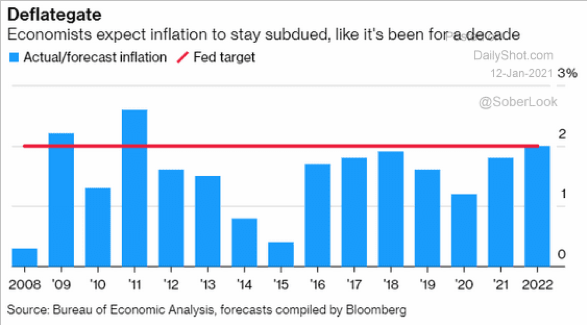
Source: Bureau of Economic Analysis, Bloomberg, The Daily Shot – 1/12/21
In 1998, the Bureau of Labor Statistics changed their computation for home prices from tracking actual home price changes to a ‘owner equivalent rent’ (OER) figure. Since 2019, BLS using the OER reports an increase of 5.12% versus the Case-Shiller Home Price Index increase of 13.73. As housing is the highest cost household expense, inflation is being under reported. The following chart shows how the CPI would change if the Case Shiller actual home price inflation index were used.
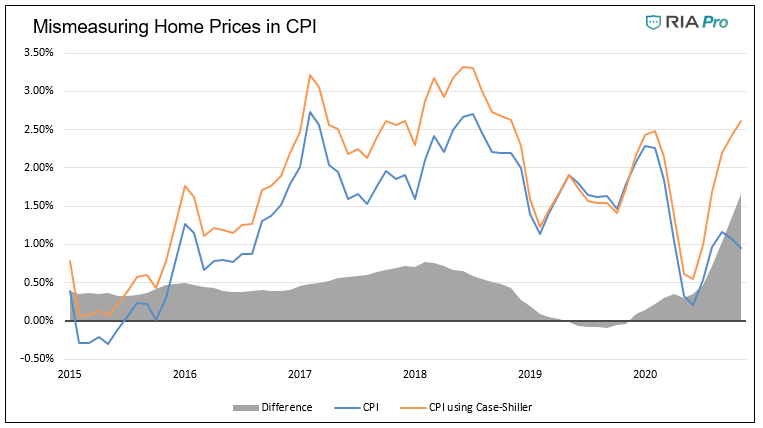
Sources: Real Investment Advisors, Bureau of Labor Statistics, Case-Shiller – 2/12/21
Unemployment
This report shows the ratio of those not in the labor force and those underemployed (U6 or 18.7M) at 45% of the total population or 119M. Indicating the real pain that workers are feeling out of work or underemployed as a percentage of the population. The ratio was going down prior to the pandemic and is now near the peak of December 2009 By J. Brett Freeze, Global Technical Analysis.
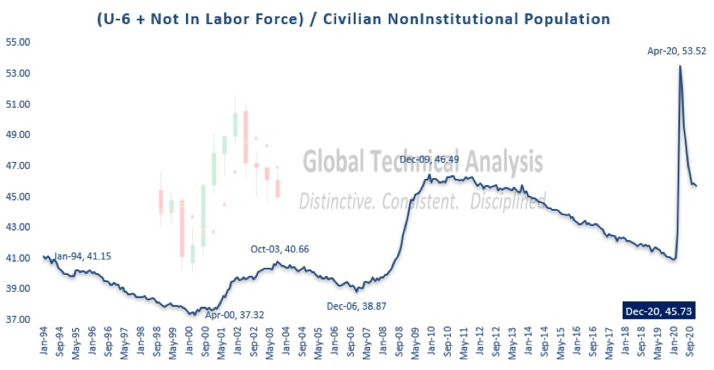
Source: Global Technical Analysis – J. Brett Freeze – 1/14/21
The Bureau of Labor Statistics released its household survey national unemployment report for February 2021 with an unemployment rate of 6.2% and 10.0M workers. Yet, the Department of Labor state unemployment report of March 11th for week ending February 20th shows 20.1M on continuing unemployment, and another 2-5M who have rolled off benefits for a total of 23M unemployed at 14.3% of the labor force of 160M.
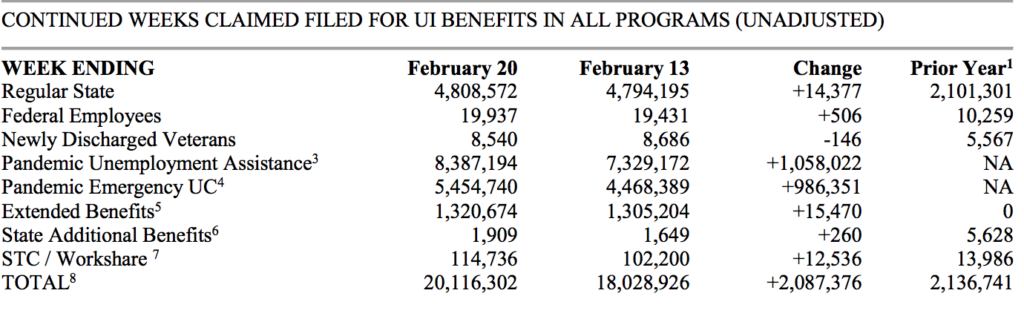
Source: Department of Labor – State Unemployment Report – 3/11/21
In December, 2020, 38.9% of Job Losers experienced a permanent job loss, and is the largest reason segment for unemployment.
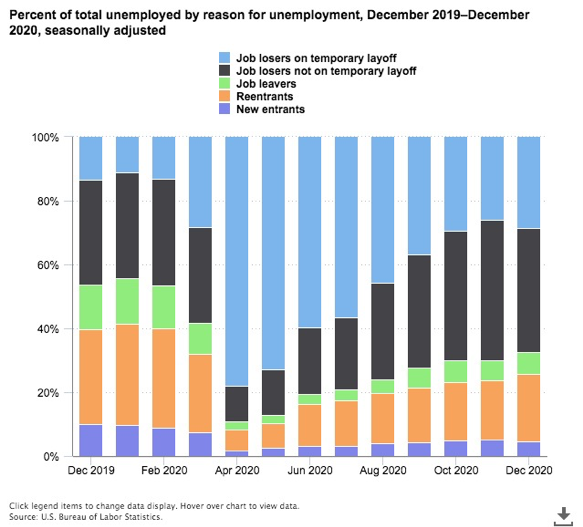
Sources: U.S. Bureau of Labor Statistics, TED – 1/14/21
Small businesses provide 60% of all U.S. jobs and 55% of all new hiring. Small business sales were hit hard by the pandemic. There has been a recent pick up in hiring but employment still ranges from 70 – 80% fewer jobs in core cities like New York to 35 – 40% fewer jobs in Dallas. Nationally, small businesses employment has declined by 41% from January 2020. In a Census survey Jan 4th to 10th, 33% of business owners reported they needed financial assistance to stay in business for the next 6 months versus 25% in November of last year.
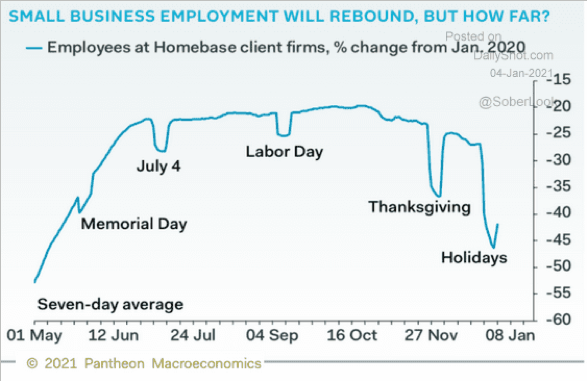
Sources: Homebase, Pantheon Macroeconomics, The Daily Shot – 1/4/21
Consumer Confidence
Consumer confidence drives spending. The Bloomberg Consumer Comfort levels has multiple sub indexes to understand in more depth why the index rose or declined for the previous week including present financial conditions, general economy, personal finances and the buying climate. Interviews conducted on January 10th, after the Capitol siege and the $900B stimulus bill showed the lowest level for the index in six months.
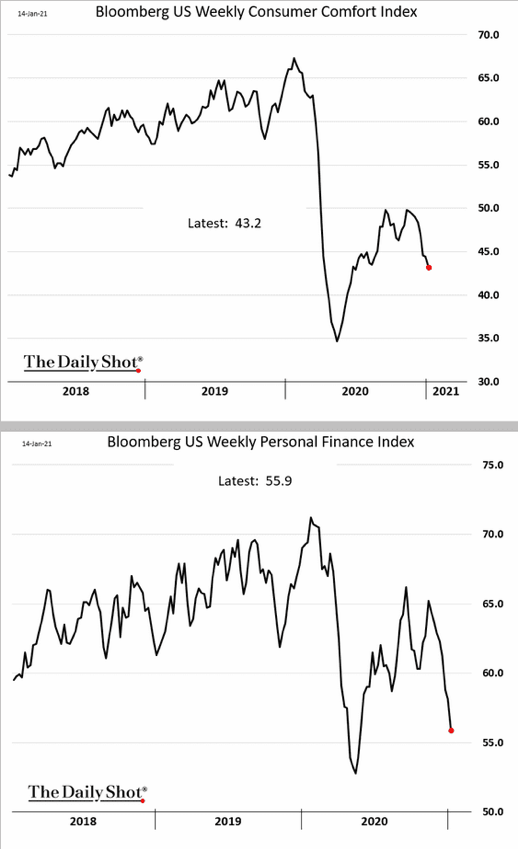
Source: Bloomberg, The Daily Shot – 1/15/21
Wages
The top .1% enjoyed a 343% increase in real annual wages since 1979, and for the bottom 90% only 22%.
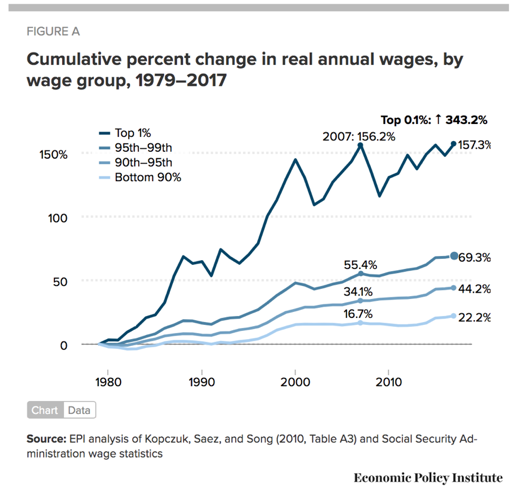
Sources: Kopczuk, Saez, and Song, Social Security Administration, The Economic Policy Institute – 1/7/21
Wealth
Wealth distribution is at the highest level of inequality since 1929. 400 people own a higher share of wealth than the bottom 60% of 150M people.
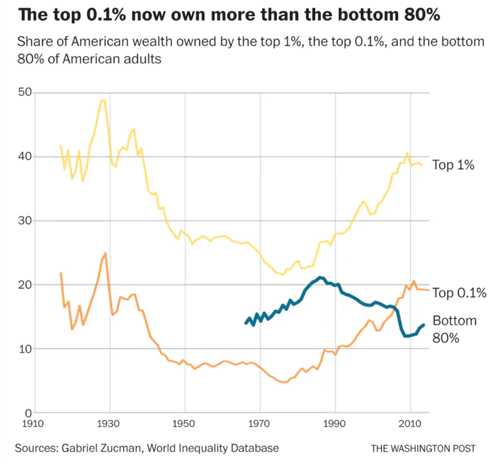
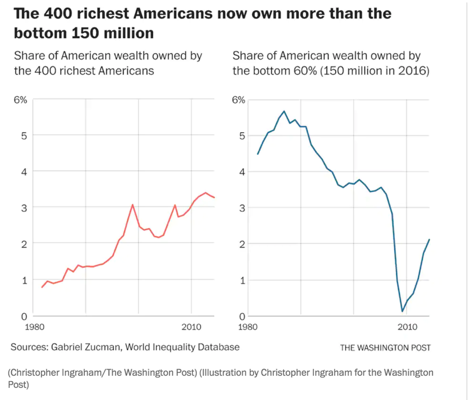
Sources: Gabriel Zucman, World Equality Database, The Washington Post – 8/17/20
Taxes
Corporations were successful lobbying Congress for provisions in the Tax Cuts and Jobs Act of 2018 to gain the lowest income tax rate as a share of national income since 1939.
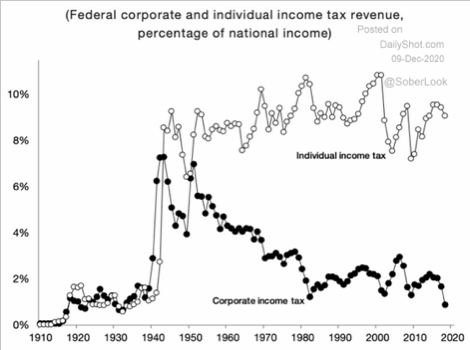
Source: The Daily Shot – 12/9/20
Real 10 Year Return at Present P/E Multiples
S & P 500 is now at 26.5 P/E based on historical analysis by J. Brett Freeze of Global Technical Analysis ten year returns are likely to be 0.
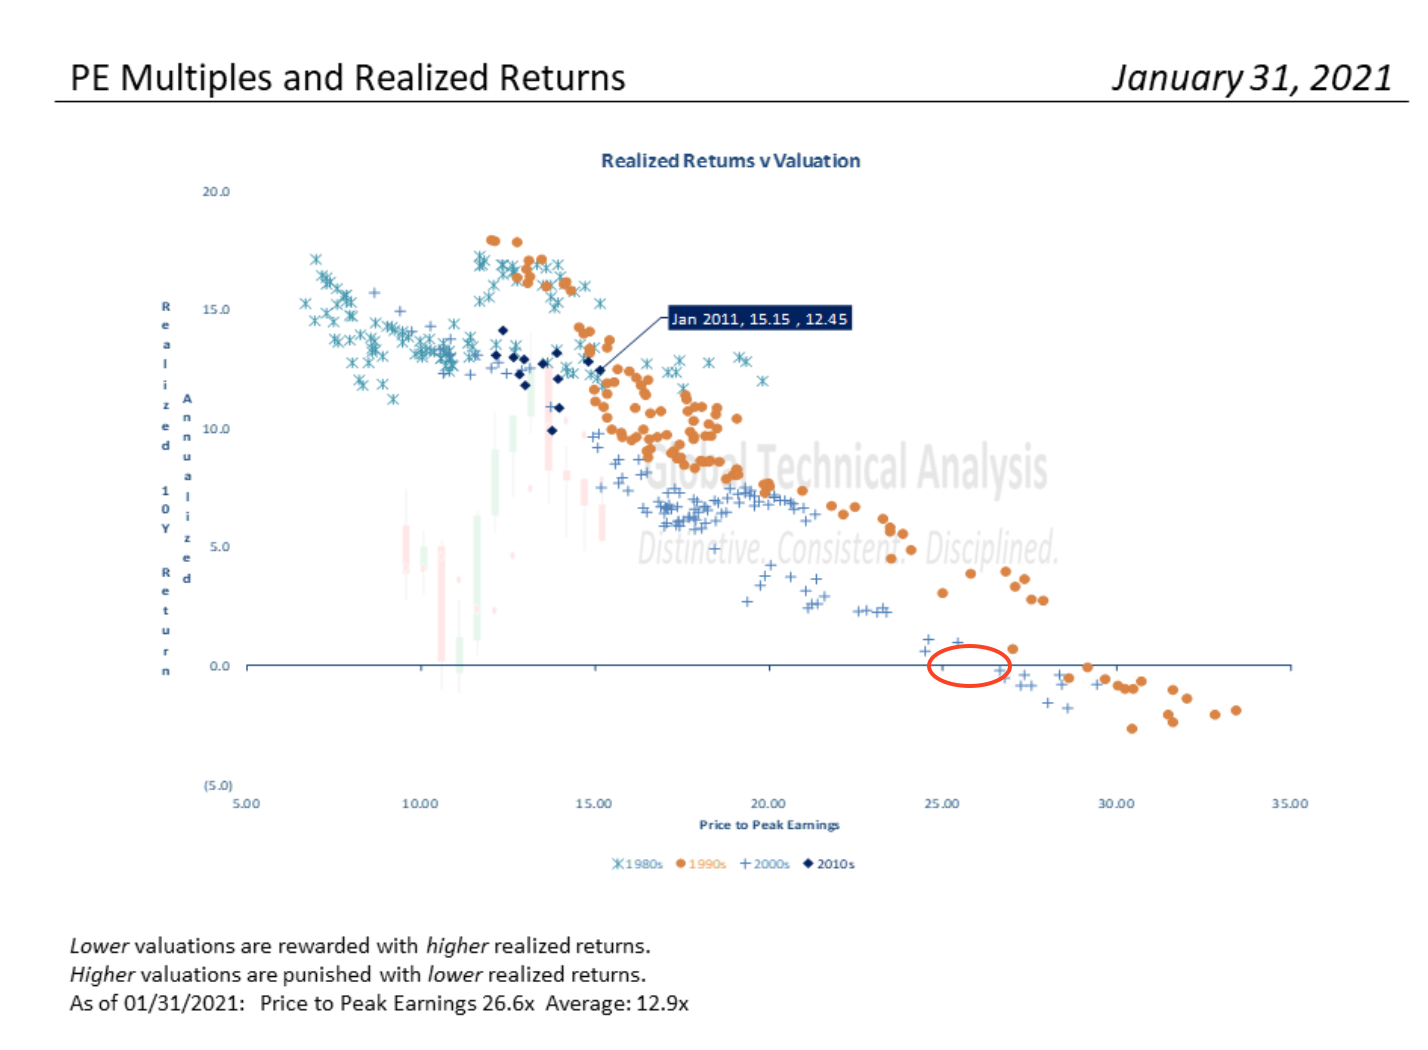
Source: J. Brett Freeze – Global Technical Analysis – 1/31/21